

EPO is the second important patent organization in the world after USPTO. It is highly important due to the presence of several industrial and economic bodies in the field of the activities of the office. Therefore, the number of nanotechnology patents and nanotechnology published patent applications of the top countries in EPO has been published in Statnano.
The data was obtained from Orbit website by using keywords presented at Stantnano website.
The number of patents and patent applications in the field of nanotechnology in EPO has increased in 2001-2013. The highest number of nanotechnology patent applications in EPO was 5,446 in 2011 while the highest number of nanotechnology patents was 4,622 in 2013. As is seen in the following charts of the number of nanotechnology patents and nanotechnology patent applications in EPO, all countries have paid specific attention to the registration and publication of nanotechnology patents in EPO due to the importance of the European technological market.
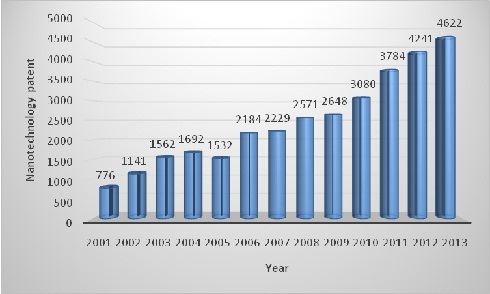
Nanotechnology Patents in EPO in 2001-2013

Nanotechnology Published Patent Applications in EPO in 2001-2013
According to the statistics, American-affiliated organizations or bodies have always had the highest number of nanotechnology patents in EPO, and the United States has always ranked first in this ranking. The share of the United States in nanotechnology patents in EPO was 33% to 45% in 2001-2013.
Top 20 countries by EPO nanotechnology patents
| Rank | Country | Nanotechnology patents |
| 1 | 1591 | |
| 2 | 775 | |
| 3 | 637 | |
| 4 | 379 | |
| 5 | 219 | |
| 6 | 182 | |
| 7 | 151 | |
| 8 | 135 | |
| 9 | 76 | |
| 10 | 70 | |
| 11 | 59 | |
| 12 | 55 | |
| 13 | 51 | |
| 14 | 40 | |
| 15 | 35 | |
| 16 | 31 | |
| 17 | 31 | |
| 18 | 23 | |
| 19 | 18 | |
| 20 | 18 |
In 2001-2004, the United States had the highest number of nanotechnology published patent applications while Japan succeeded to rank first in 2005-2010. In recent years (2011-2013), the United States ranked first once again. The United States shared 23% to 35% of all nanotechnology published patent applications in EPO in 2001-2013, minimum of which was in 2009 and the maximum was in 2001.
The two countries, the United States and Japan, have always had more than half of nanotechnology published patent applications in EPO, which indicates the special attention of these two countries to the European nanotechnology markets.
