
According to statistical data, a total number of 709454 patents have been published in all fields of science and technology in USPTO in 2015, which is about three times larger than the total number of patents in European Patent Office (EPO). There are 326971 granted patents and 382483 published patent applications in USPTO in 2015. Table 1 lists the share of countries in the number of patents published in USPTO in 2015, the ranking of the countries, and the ratio of the number of country's patents to the total number of patents published in USPTO. More than 90% of all patents published in USPTO belong to the top 10 countries. A number of 156 countries have published patent applications in USPTO while 141 countries have granted patents. This fact shows the importance of United States Office in technology and global markets. The following table shows the top 50 countries in publication of granted patents or published patent applications in USPTO.
| Rank | Country | No. Published Patent Applications | Share of Published Patent Applications (%) | Rank | Country | No. Granted Patents | Share of Granted Patents (%) |
|---|---|---|---|---|---|---|---|
| 1 |  USA USA | 181069 | 47.34 | 1 | USA | 164919 | 0.44 |
| 2 |  Japan Japan | 63536 | 16.61 | 2 | Japan | 55351 | 6.93 |
| 3 |  South Korea South Korea | 26097 | 6.82 | 3 | South Korea | 20703 | 6.33 |
| 4 |  Germany Germany | 20075 | 5.25 | 4 | Germany | 16618 | 5.08 |
| 5 |  Taiwan Taiwan | 15983 | 4.18 | 5 | Taiwan | 13179 | 4.03 |
| 6 |  China China | 14065 | 3.68 | 6 | China | 8706 | 2.66 |
| 7 |  France France | 8651 | 2.26 | 7 | France | 7100 | 2.17 |
| 8 |  Canada Canada | 6610 | 1.73 | 8 | Canada | 5528 | 1.69 |
| 9 |  UK UK | 6463 | 1.69 | 9 | UK | 4777 | 1.46 |
| 10 |  Switzerland Switzerland | 5142 | 1.34 | 10 | Switzerland | 4598 | 1.41 |
| 11 |  Netherlands Netherlands | 4685 | 1.22 | 11 | Netherlands | 4065 | 1.24 |
| 12 |  Sweden Sweden | 4257 | 1.11 | 12 | Sweden | 3438 | 1.05 |
| 14 |  Italy Italy | 2647 | 0.69 | 13 | Italy | 2243 | 0.69 |
| 15 |  Finland Finland | 2239 | 0.59 | 15 | Finland | 1662 | 0.51 |
| 16 |  Singapore Singapore | 1937 | 0.51 | 15 | Singapore | 1662 | 0.51 |
| 17 |  Australia Australia | 1896 | 0.50 | 17 | Australia | 1534 | 0.47 |
| 18 |  India India | 1712 | 0.45 | 18 |  Denmark Denmark | 1175 | 0.36 |
| 19 | Denmark | 1550 | 0.41 | 19 |  Belgium Belgium | 982 | 0.30 |
| 20 |  Austria Austria | 1423 | 0.37 | 20 | Austria | 965 | 0.30 |
| 21 | Belgium | 1331 | 0.35 | 21 | India | 897 | 0.27 |
| 22 |  Spain Spain | 1056 | 0.28 | 22 |  Bermuda Bermuda | 790 | 0.24 |
| 23 |  Ireland Ireland | 904 | 0.24 | 23 | Ireland | 764 | 0.23 |
| 24 |  Norway Norway | 780 | 0.20 | 24 | Spain | 668 | 0.20 |
| 25 |  Luxembourg Luxembourg | 578 | 0.15 | 25 | Luxembourg | 641 | 0.20 |
| 26 |  Saudi Arabia Saudi Arabia | 567 | 0.15 | 26 | Norway | 542 | 0.17 |
| 27 |  Russia Russia | 469 | 0.12 | 27 | Saudi Arabia | 409 | 0.13 |
| 28 |  New Zealand New Zealand | 406 | 0.11 | 28 | New Zealand | 280 | 0.09 |
| 29 |  Brazil Brazil | 379 | 0.10 | 29 | Brazil | 278 | 0.09 |
| 30 |  Mexico Mexico | 268 | 0.07 | 30 | Russia | 257 | 0.08 |
| 31 |  Poland Poland | 231 | 0.06 | 31 |  Liechtenstein Liechtenstein | 154 | 0.05 |
| 32 |  Turkey Turkey | 211 | 0.06 | 32 |  South Africa South Africa | 145 | 0.04 |
| 33 |  Malaysia Malaysia | 208 | 0.05 | 33 | Poland | 142 | 0.04 |
| 34 | Liechtenstein | 190 | 0.05 | 34 | Mexico | 138 | 0.04 |
| 35 | South Africa | 182 | 0.05 | 35 | Turkey | 105 | 0.03 |
| 36 |  Czech Republic Czech Republic | 133 | 0.03 | 36 | Malaysia | 93 | 0.03 |
| 37 |  UAE UAE | 96 | 0.03 | 37 |  Cyprus Cyprus | 68 | 0.02 |
| 38 |  Greece Greece | 94 | 0.02 | 37 |  Hungary Hungary | 68 | 0.02 |
| 39 |  Portugal Portugal | 93 | 0.02 | 39 |  Iceland Iceland | 66 | 0.02 |
| 40 | Hungary | 92 | 0.02 | 40 |  Kuwait Kuwait | 64 | 0.02 |
| 41 | Iceland | 88 | 0.02 | 41 |  Chile Chile | 61 | 0.02 |
| 42 |  Malta Malta | 82 | 0.02 | 41 | Czech Republic | 61 | 0.02 |
| 43 | Cyprus | 75 | 0.02 | 43 |  Thailand Thailand | 57 | 0.02 |
| 44 | Chile | 73 | 0.02 | 44 | UAE | 52 | 0.02 |
| 45 |  Argentina Argentina | 63 | 0.02 | 45 | Greece | 49 | 0.01 |
| 46 | Thailand | 61 | 0.02 | 46 | Portugal | 46 | 0.01 |
| 47 |  Colombia Colombia | 58 | 0.02 | 47 |  Bahamas Bahamas | 44 | 0.01 |
| 48 |  Bulgaria Bulgaria | 49 | 0.01 | 48 | Argentina | 43 | 0.01 |
| 49 | Bahamas | 47 | 0.01 | 48 | Bulgaria | 43 | 0.01 |
| 50 |  Iran Iran | 44 | 0.01 | 50 |  Slovenia Slovenia | 39 | 0.01 |
| World | 382483 | 100 | World | 326971 | 100 |
The following figure shows the share of continents in the publication of patents in USPTO. As is seen in the figure, the three continents America, Asia, and Europe have very high share (about 98.5%) of all patents published in USPTO. The important point is the very low share of Africa in the publication of patents despite the large number of its countries.
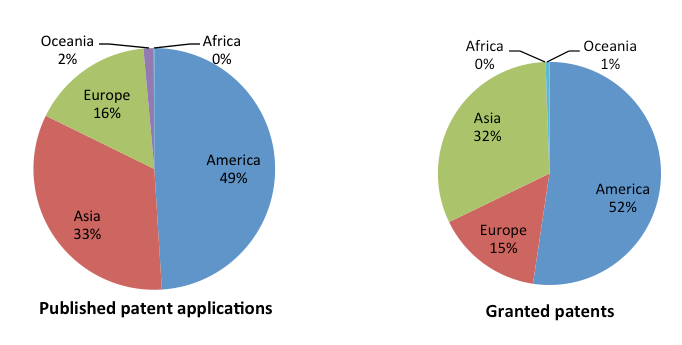
Share of Continents in the Publication of Patents in USPTO in 2015
According to statistical investigation by using data gathered from Orbit Database, a total number of 19544 nanotechnology related patents have been published in USPTO in 2015, among which 8588 are granted patents and 10956 are published patent applications. Nanotechnology related patents have a share of about 2.8% of all patents published in USPTO in 2015, which is two times greater than the share of nanotechnology patents in EPO with a share of 1.4%. The following figures show the share of nanotechnology related patents to all patents published in USPTO for the top 10 countries. The countries China and South Korea are among the top 10 countries in this ranking.
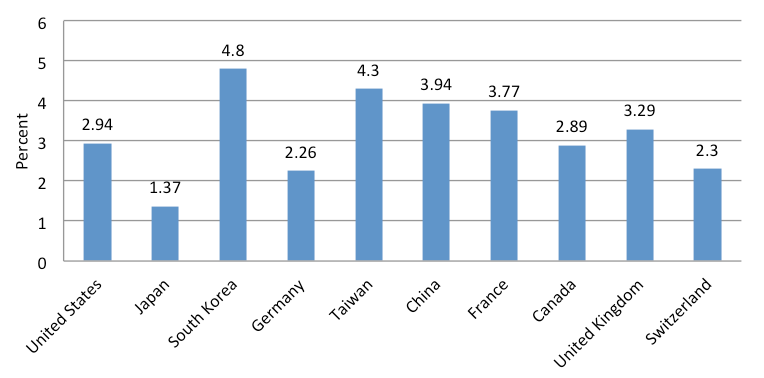
Ratio of the number of nanotechnology related published patent applications to all patents published in USPTO for the top 10 countries in 2015
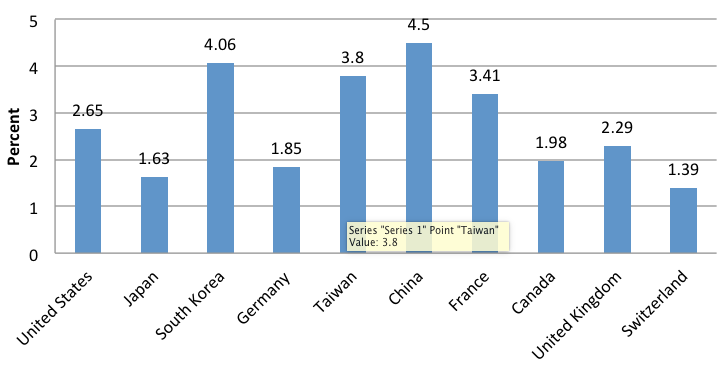
Ratio of the number of nanotechnology related granted patents to all patents published in USPTO for the top 10 countries in 2015