
The team showed the resolving power of nano-XANES by mapping states of iron of a reference sample composed of stainless steel and hematite nanoparticles using 50-nanometer scanning steps. Using nano-XANES, the team also studied the trace secondary phases of lithium iron phosphate (LFP) particles and noted the individual iron(Fe)-phosphide nanoparticles within the pristine lithium iron phosphate, while partially delithiated particles showed Fe-phosphide nanonetworks.
This work on nano-XANES highlight the contradictory reports on iron-phosphide morphology within the existing literature and will bridge the capability gap of spectromicroscopy methods to provide exciting research opportunities.
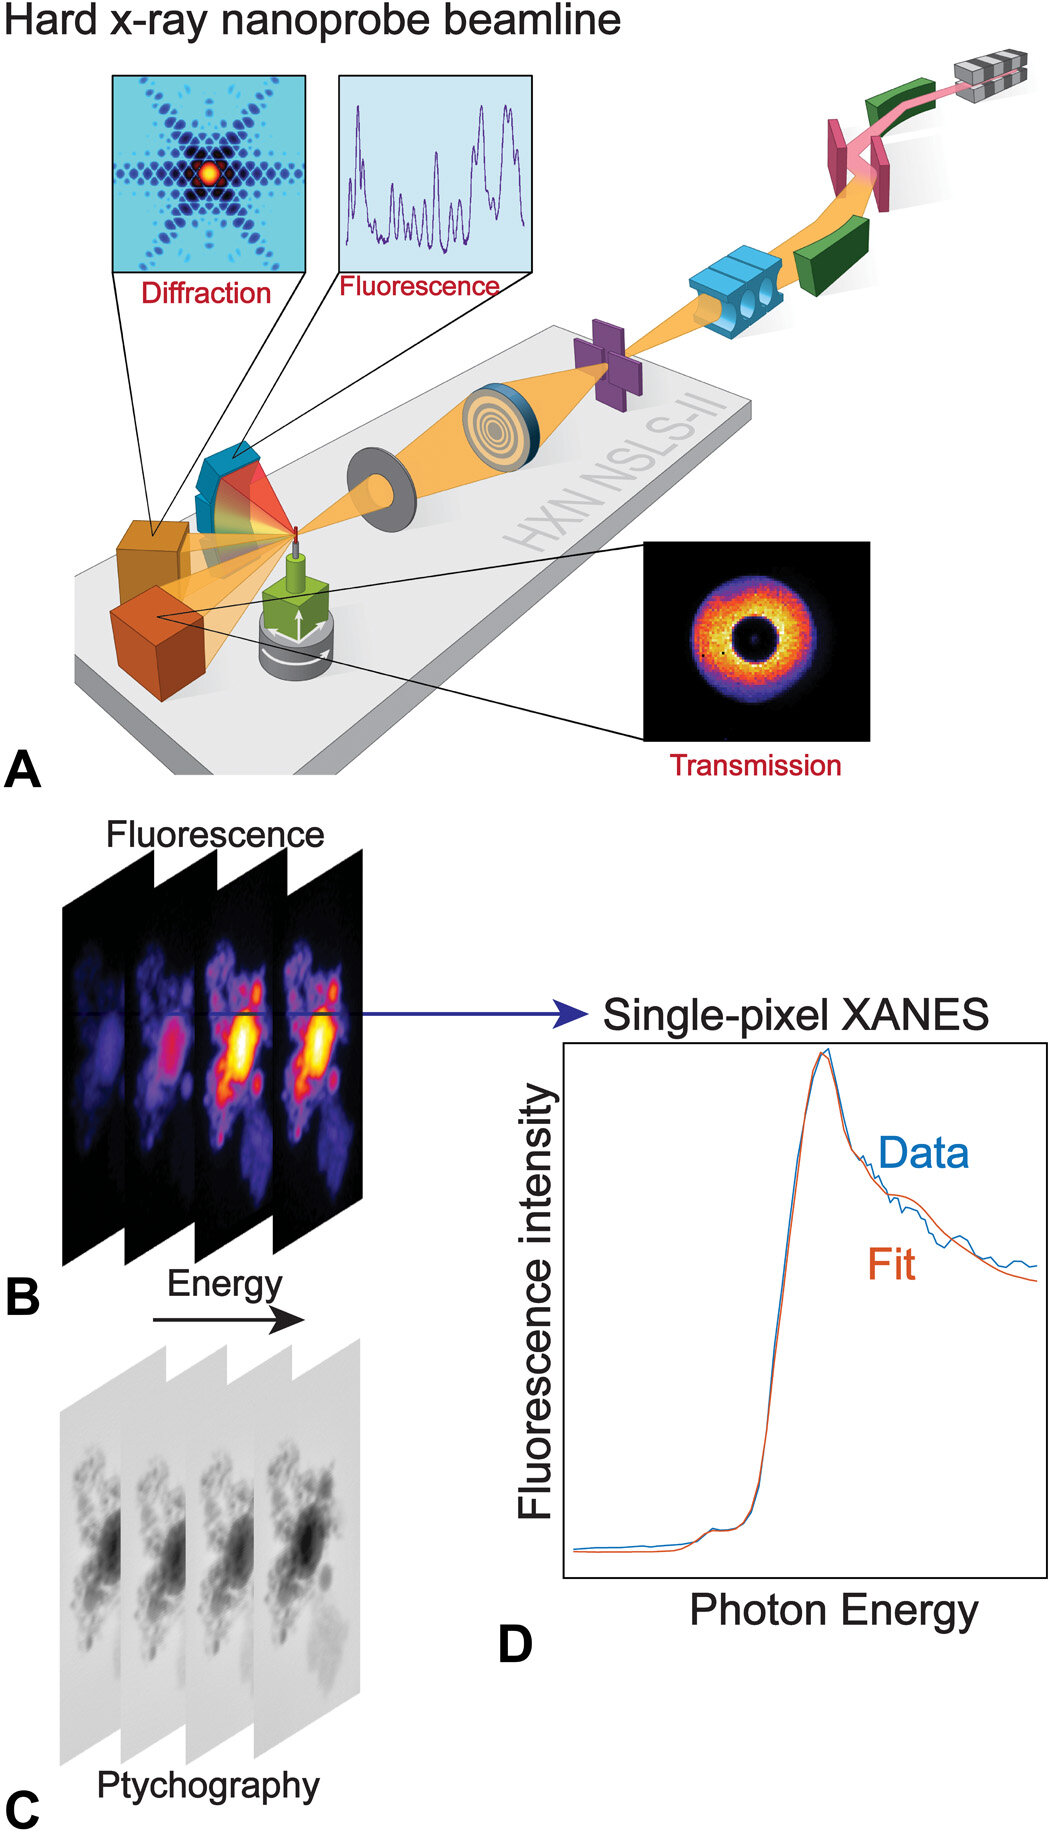
Acquisition of nano-XANES. (A) Schematic of the hard x-ray nanoprobe beamline of NSLS-II. As the sample is raster-scanned by a nanobeam produced from a Fresnel zone plate (FZP), diffraction (not used for samples studied in this work), fluorescence, and transmitted signals can all be collected simultaneously. At energy points along the absorption edge, a series of x-ray fluorescence [nano–x-ray fluorescence (XRF)] maps (B) and phase images from ptychography reconstruction (C) are obtained. (D) Representative fluorescence-yield single-pixel XANES fitted with reference standards.
Multidisciplinarity of nanotechnology
Nanotechnology is a rapidly growing field and has expanded to multidisciplinary research fields in the past two decades. The field has also unveiled microscopic characterization tools to understand the chemical and physical properties of materials with a significant role in materials science. Researchers have developed a myriad of techniques to study the spectrum of nanomaterials including transmission electron microscopy (TEM) for imaging at atomic resolution and electron energy-loss spectroscopy (EELS) to detect element-specific chemical states and data.
However, EELS is limited by poor penetration depth and plural scattering, while in contrast, X-rays have a wide energy range alongside excellent penetration power and high chemical sensitivity. For example, X-ray absorption spectrometry (XAS) is widely used to investigate the chemical state of the absorbing atom. The quantitative chemical imaging achieved with a hard X-ray nanoprobe and single pixel XANES (X-ray absorption near-edge structure) at the nanoscale is still an unchartered territory. In this work, Pattammattel et al. therefore detailed the fluorescence-yield hard X-ray XANES at the nanoscale, hitherto referred to as nano-XANES.
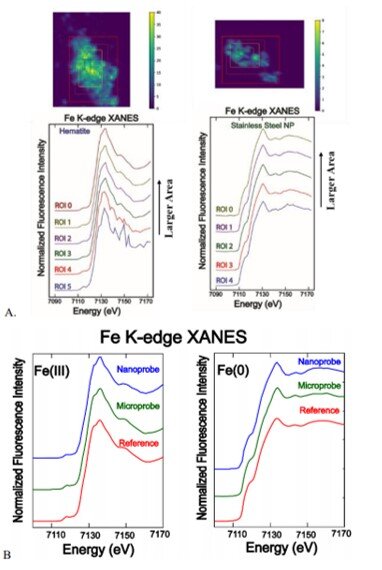
Quality of nano-XANES and comparison with micro-XANES. A) Fe K-edge nanoXANES spectra of hematite [Fe(III)] and stainless steel [Fe(0)] particles with different integration areas. B) A comparison of nano-XANES Fe(III) and Fe(0) spectra with micro-XANES and the hematite and stainless steel reference standards (collected at the microprobe beamline) showing identical features.
Nano-XANES acquisition
The scientists demonstrated the technique by performing a benchmark experiment using a reference sample containing mixed stainless steel and hematite nanoparticles. They then applied the technique to characterize the chemical species (i.e. speciation) of lithium battery particles (containing LixFePO4, abbreviated LFP), with a trace secondary Fe-phosphide/Fe-phosphocarbide phase.
The high spatial resolution and detection sensitivity of nano-XANES provided unique insight into materials properties under complex environments. The team conducted the nano-XANES experiment at the Hard X-ray Nanoprobe Beamline at the National Synchrotron Light Source, at the Brookhaven National Laboratory. Using the simultaneously acquired far-field diffraction patterns, Pattammattel et al. generated phase images with a higher spatial resolution through ptychography reconstruction.
They then aligned the elemental maps by using an imaging software and created a three-dimensional (3-D) image stack to produce spatially resolved chemical state information. The reference sample used in the work contained stainless steel nanoparticles, hematite nanoparticles and a mixture of the two with a varying thickness from tens to a few hundred nanometers. The team chose the Fe(0)/Fe(III) reference system due to two reasons, which included the distinguishable spectral features and the accuracy of the fitting method.
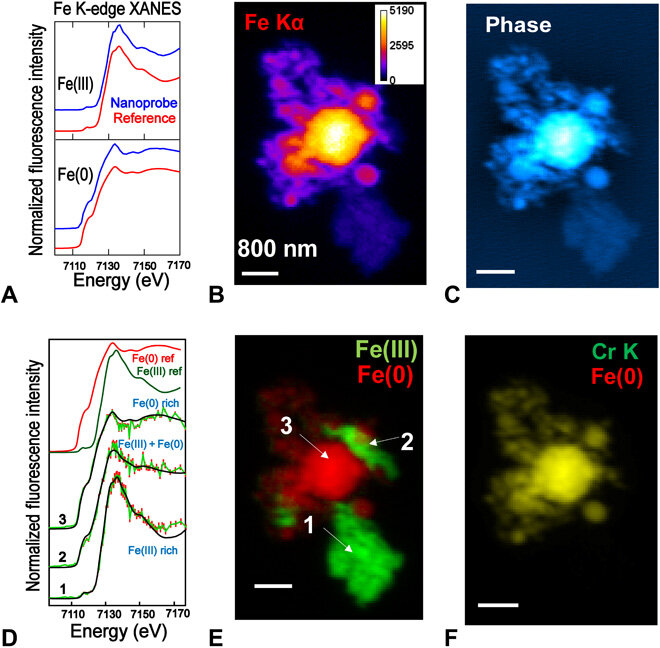
Chemical imaging with nano-XANES. (A) Comparison of summed Fe K-edge nano-XANES spectra of Fe(III) and Fe(0) nanoparticles with the bulk ones. (B) and (C) are Fe-Kα XRF and ptychography phase images of hematite [Fe(III)] and stainless steel [Fe(0)] nanoparticle aggregate. (D) Representative single-pixel spectra and their fittings at different locations of the particle are marked in (E), which shows the chemical state map of Fe. (F) XRF map of chromium (alloyed with Fe), overlaid with Fe(0). It confirms the fidelity of the fitting. Scale bars, 800 nm. Data collection details: 120 × 80 points, 50-nm steps, 40-ms dwell time, 77 energy points, and ~8.2 hours total acquisition time.
Troubleshooting nano-XANES acquisition
The biggest challenge of the technique was maintaining beam stability as the energy varied so that the size and position of the nanobeam did not change, while the illumination of the lens remained constant. The scientists overcame the challenges by aligning the system to predefined energy points, and by creating a look-up table to correct motor positions.
The stability of the associated microscope was also critical in the long-term since many acquisitions took up to 10 hours. The team assessed the quality of nano-XANES by comparing the spectrum of each species with a bulk measurement conducted at the X-ray fluorescence microprobe beamline. Pattammattel et al. compared the results with additional techniques for spectromicroscopic imaging to conclude that the fluorescence-yield nano-XANES provided the highest sensitivity.
Detecting trace secondary phases in lithium iron phosphate particles
The scientists then used nano-XANES to follow single-particle phase transformations in lithium-ion battery materials. They identified olivine-structured lithium iron phosphate (LiFePO4, LFP) with high chemical contrast and spatial resolution to image chemical changes during battery performance.
The LFP is a cathode material commercially used in Li-ion batteries due to its long lifecycle, cost-effectiveness, and low-environmental toxicity. Carbon-coated LFP particles can enhance electronic conductivity but also cause unexpected side reactions including the formation of nanostructured iron-rich compounds (classified in this work as Fe-phosphides).
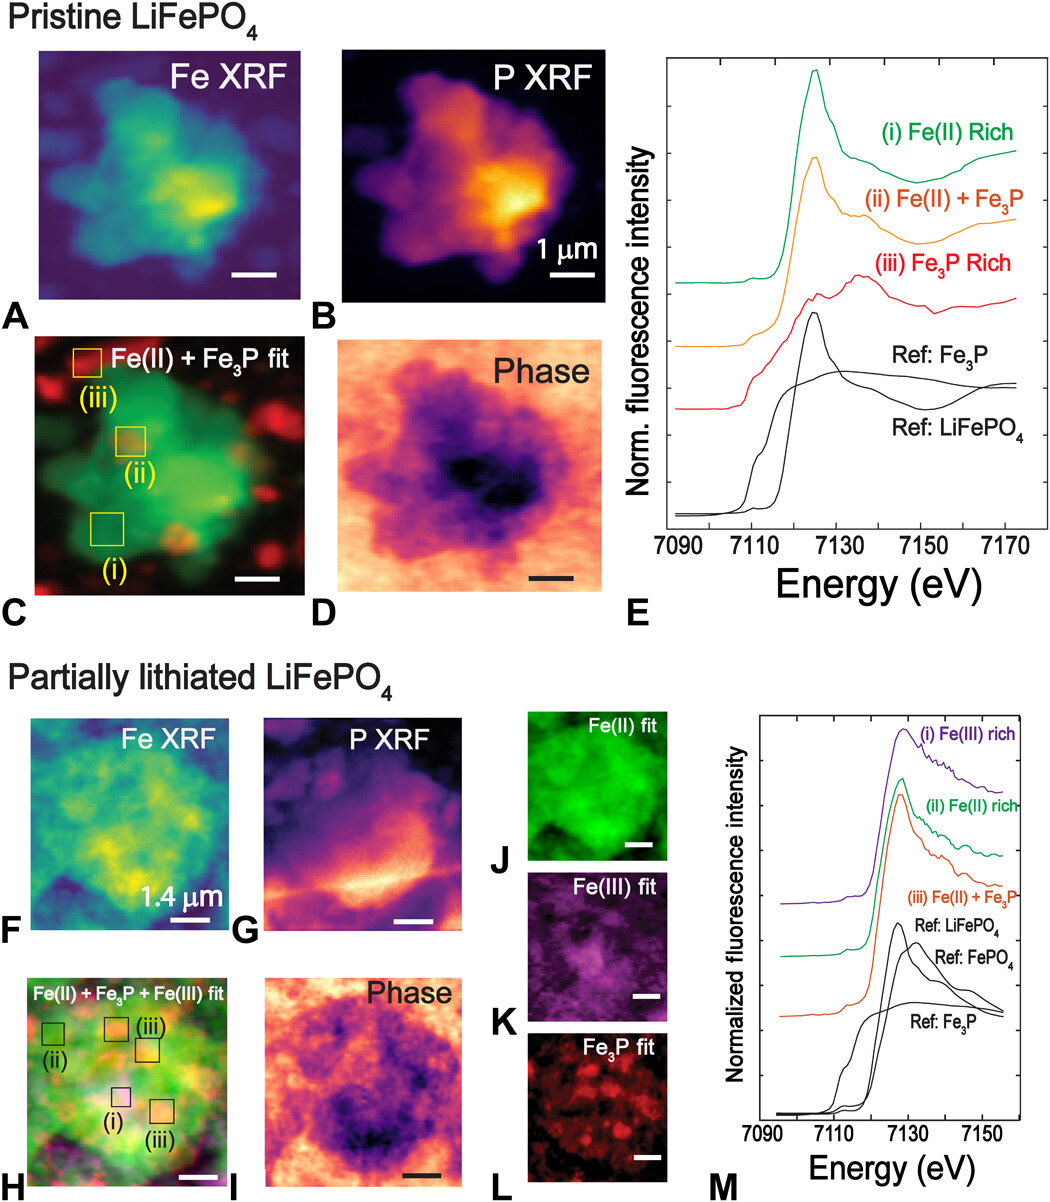
Chemical imaging to identify Fe-rich phases in pristine (top) and partially lithiated LFP (bottom). (A and B) XRF map of Fe and P of pristine LFP particle. (C) Chemical state map produced by fitting with Fe(II) and Fe3P reference standards. (D) Phase image from ptychography reconstruction. (E) XANES spectra from selected regions displaying the spectral changes. Scale bars, 1 μm. Data collection details: 100 × 100 points, 60-nm steps, 30-ms dwell time, 53 energy points, and ~5 hours total acquisition time. (F and G) XRF map of Fe and P of the partially lithiated LFP particle. (H) Chemical state map produced by fitting with Fe(II), Fe(III), and Fe3P reference standards. (I) Phase image from ptychography reconstruction. (J to L) Deconvoluted distribution of Fe(II), Fe3P, and Fe(III). (M) XANES spectra from selected regions displaying the spectral changes with deconvoluted phases. Conductive carbon and polymer binder in the electrode are responsible for the background features seen in the phase images. Scale bars, 1.4 μm. Data collection details: 100 × 100 points, 70-nm steps, 30-ms dwell time, 65 energy points, and ~6 hours total acquisition time.
Nano-XANES with high spatial resolution provided a unique X-ray technique to detect chemical species of heterogenous matrices such as carbon-coated LFP (lithium iron phosphate). While spectroscopic differentiation was not possible between Fe-phosphides and carbides due to their similarity in local bonding, the team achieved chemical mapping along with Fe (II) and Fe (III) references.
The pristine samples exhibited several 100 to 1000 nm particles of Fe-phosphides surrounding the LFP particle with clear grain boundaries and high resolution in agreement with electron microscopy studies. Since X-rays did not penetrate through the entire thickness of the sample, Pattammattel et al. could not determine if the Fe-phosphide network formed on the surface or inside the particle during this study.
The nano-XANES technology provided a unique characterization tool with high penetration depth and detection sensitivity for future investigations.
Applications of nano-XANES
The hard X-ray nano-XANES technique can fluorescently bridge the capability gap of existing spectromicroscopy techniques. The team foresee broad applications of the method for nano-speciation of catalytic systems, electrode materials, environmental pollutants and bio-nanosystems.
However, they must first overcome a few challenges of the method including self-absorption problems with thick and dense samples, radiation damage by the nanobeam and slow imaging speed. In this way, A. Pattammattel and colleagues expect an optimized tomographic nano-XANES technique to have broad impact on multidisciplinary nanotechnology research and the discovery of unexpected or hidden phases of materials in the future.
The improved techniques will greatly enhance the detection capability of nano-XANES to identify trace chemical phases and realize higher chemical specificity as well as detect local bonding structures.
Read the original article on Phys org.