
According to statistical evaluation, a number of 211057 patents have been published in all fields of science and technology in EPO in 2015, which is about one-third of all patents published in United States Patent and Trademark Office (USPTO). Among these patents, 69528 are granted patents and 141529 are published patent applications. The top 10 countries in the publication of patents possess more than 85% of all patents published in EPO. A number of 107 countries possess at least one published patent application in EPO in 2015 while 81 countries possess at least one granted patent. This fact is a proof of the importance of Europe after the United States to various countries in the field of technology and market. The following table lists the top 50 countries in the publication of patents in EPO.
|
Rank |
Country |
Granted Patents |
Share (%) |
Rank |
Country |
Published Patent Applications |
Share (%) |
|
1 |
15428 |
21.89 |
1 |
37205 |
26.07 |
||
|
2 |
14737 |
20.91 |
2 |
22857 |
16.01 |
||
|
3 |
10776 |
15.29 |
3 |
21564 |
15.11 |
||
|
4 |
5614 |
7.96 |
4 |
9950 |
6.97 |
||
|
5 |
3403 |
4.83 |
5 |
6206 |
4.35 |
||
|
6 |
2572 |
3.65 |
6 |
5680 |
3.98 |
||
|
7 |
2259 |
3.20 |
7 |
5570 |
3.88 |
||
|
8 |
2247 |
3.19 |
8 |
4627 |
3.24 |
||
|
9 |
2013 |
2.86 |
9 |
4295 |
3.01 |
||
|
10 |
1985 |
2.82 |
10 |
3908 |
2.74 |
||
|
11 |
1490 |
2.08 |
11 |
3643 |
2.55 |
||
|
12 |
1087 |
1.54 |
12 |
2016 |
1.41 |
||
|
13 |
914 |
1.30 |
13 |
1823 |
1.28 |
||
|
14 |
791 |
1.12 |
14 |
1666 |
1.17 |
||
|
15 |
760 |
1.08 |
15 |
1530 |
1.07 |
||
|
16 |
744 |
1.06 |
16 |
1384 |
0.97 |
||
|
17 |
565 |
0.80 |
17 |
1380 |
0.97 |
||
|
18 |
445 |
0.63 |
18 |
1175 |
0.82 |
||
|
19 |
339 |
0.48 |
19 |
796 |
0.56 |
||
|
20 |
279 |
0.40 |
20 |
533 |
0.37 |
||
|
21 |
264 |
0.37 |
21 |
520 |
0.36 |
||
|
22 |
222 |
0.31 |
22 |
468 |
0.33 |
||
|
23 |
220 |
0.31 |
23 |
415 |
0.29 |
||
|
24 |
189 |
0.27 |
24 |
397 |
0.28 |
||
|
25 |
156 |
0.22 |
25 |
390 |
0.27 |
||
|
26 |
121 |
0.17 |
26 |
373 |
0.26 |
||
|
27 |
104 |
0.15 |
27 |
333 |
0.23 |
||
|
28 |
85 |
0.12 |
28 |
241 |
0.17 |
||
|
29 |
78 |
0.11 |
29 |
202 |
0.14 |
||
|
29 |
78 |
0.11 |
30 |
198 |
0.14 |
||
|
31 |
66 |
0.09 |
31 |
196 |
0.14 |
||
|
32 |
64 |
0.09 |
32 |
185 |
0.13 |
||
|
33 |
53 |
0.08 |
33 |
122 |
0.09 |
||
|
34 |
51 |
0.07 |
34 |
114 |
0.08 |
||
|
35 |
48 |
0.07 |
35 |
105 |
0.07 |
||
|
36 |
45 |
0.06 |
36 |
94 |
0.07 |
||
|
37 |
41 |
0.06 |
37 |
81 |
0.06 |
||
|
38 |
28 |
0.04 |
38 |
65 |
0.05 |
||
|
39 |
26 |
0.04 |
39 |
61 |
0.04 |
||
|
40 |
23 |
0.03 |
39 |
61 |
0.04 |
||
|
41 |
17 |
0.02 |
41 |
42 |
0.03 |
||
|
42 |
16 |
0.02 |
42 |
41 |
0.03 |
||
|
43 |
15 |
0.02 |
43 |
38 |
0.03 |
||
|
44 |
12 |
0.02 |
44 |
34 |
0.02 |
||
|
44 |
12 |
0.02 |
45 |
33 |
0.02 |
||
|
46 |
10 |
0.01 |
46 |
31 |
0.02 |
||
|
46 |
10 |
0.01 |
47 |
30 |
0.02 |
||
|
48 |
8 |
0.01 |
48 |
29 |
0.02 |
||
|
48 |
Mauritius |
8 |
0.01 |
48 |
29 |
0.02 |
|
|
48 |
8 |
0.01 |
50 |
21 |
0.01 |
||
|
World |
141521 |
World |
69528 |
||||
The following figure shows the share of various continents in the publication of patents in EPO. As is seen in the figure, the three continents Europe, America, and Asia have a very high share (approximately 99%) in the publication of patents. The important point is the very low share of Africa despite the high number of countries in this continent.
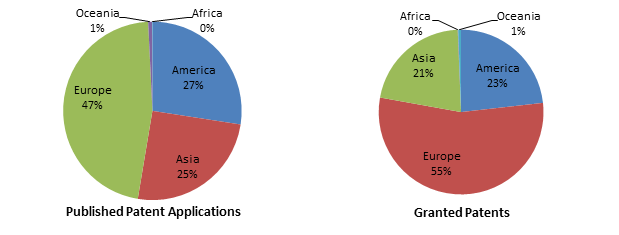
Share of Continents in Publication of Patents in EPO in 2015
According to statistical evaluation based on Orbit Database, a number of 3065 nanotechnology patents have been published in EPO in 2015, among which 1441 are granted patents and 1624 are published patent applications. Nanotechnology patents have a share of about 1.45% in EPO, which is considered a lower share in comparison with the share of 2.8% of nanotechnology patents from all patents published in USPTO. The following figure shows the share of nanotechnology patents from all patents published in EPO for the top 10 countries. Similar to USPTO, the two countries China and South Korea are the leading countries among the top 10 ones.
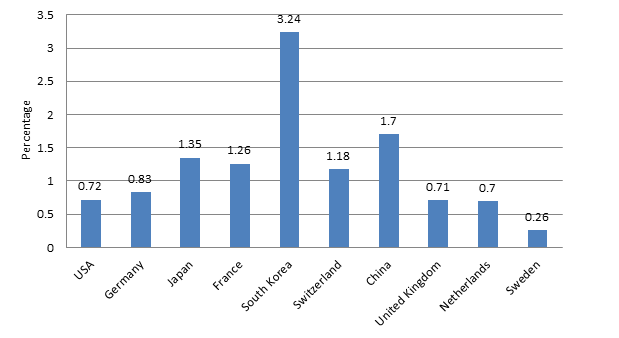
Ratio of the Number of Nanotechnology Published Patent Applications to All Published Patent Applications in EPO in 2015 for Top 10 Countries
United States, France, and South Korea are the leading countries among the top 10 countries in the ratio of the number of nanotechnology patents to all patents in EPO. The top countries have a share of less than 3% in this indicator, which shows the focus of these countries on all aspects of science and technology.
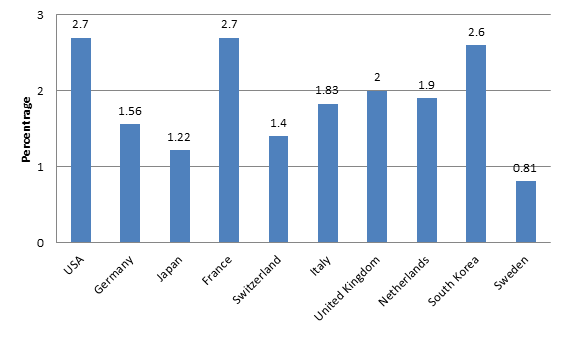
Ratio of the Number of Nanotechnology Granted Patents to All Published Patent Applications in EPO in 2015 for Top 10 Countries