As reported by StatNano, around 365,000 published patent applications were filed at both the USPTO and the EPO during the first 9 months of 2019, of which more than 10,300 – 2.8 percent – were in the field of nanotechnology; however, nanotechnology accounts for the 10 percent of the world’s total scientific publications. These statistical data have been collected by StatNano through a search string relating to nanoscience and nanotechnology in corresponding databanks such as the Web of Science and Orbit.
As always, the USA possesses the world’s most active market for innovations in the field of nanotechnology, in so far as more than 8,900 nanotechnology patents of 2019 were filed at the USPTO. In addition to the USA and Europe, China and South Korea are also considered by the innovators and patent assignee of nanotechnology and nanoscience areas, but given the limitation of their offices’ search engines, it is not possible to search and gather information about various countries’ patents in these offices.
The following table shows different countries’ total number of published patent applications in the field of nanotechnology at the USPTO and the EPO by the end of September 2019, as well as each country’s share in the total patents. During the mentioned period, there were 62 countries that had at least one patent relating to nanotechnology, among which the USA topped the list by far with holding around half of the nanotechnology patents of 2019. The next four places of the list – second to fifth – were taken by the East Asian countries, i.e. South Korea, Japan, China, and Taiwan, followed by pioneering European countries, i.e. Germany, France, and the UK.
Table 1. The total number of different countries’ nanotechnology published patent applications at the USPTO and the EPO until the end of September 2019
| Rank | Country | Published Nano-patents | Share (%) |
| 1 | USA | 4666 | 45.16 |
| 2 | South Korea | 1105 | 10.69 |
| 3 | Japan | 918 | 8.88 |
| 4 | China | 825 | 7.98 |
| 5 | Taiwan | 481 | 4.65 |
| 6 | Germany | 428 | 4.14 |
| 7 | France | 262 | 2.54 |
| 8 | UK | 197 | 1.91 |
| 9 | Canada | 182 | 1.76 |
| 10 | Switzerland | 156 | 1.51 |
| 11 | Saudi Arabia | 148 | 1.43 |
| 12 | Netherlands | 114 | 1.10 |
| 13 | Spain | 91 | 0.88 |
| 14 | Singapore | 88 | 0.85 |
| 15 | Belgium | 88 | 0.85 |
| 16 | Italy | 66 | 0.64 |
| 17 | Australia | 60 | 0.58 |
| 18 | Austria | 60 | 0.58 |
| 19 | India | 54 | 0.52 |
| 20 | Sweden | 53 | 0.51 |
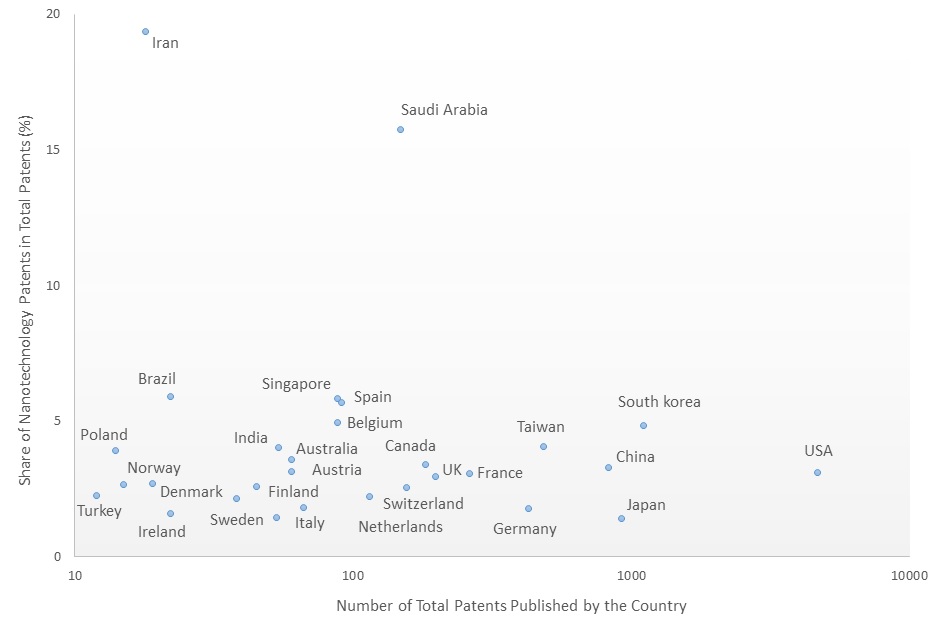
According to Figure 1, which illustrates the share of nanotechnology patents in the total patents published by different countries in 2019, in a number of them such as Iran and Saudi Arabia, nanotechnology patents account for the exceptionally large percentages of their total patents, even though neither of them has a large number of total nanotechnology patents compared to the top 20 countries listed in table 1. For instance, 18 out of 93 patents published by Iran at the USPTO in 2019 were in the field of nanotechnology, comprising around 19 percent of the total, which reveals the country places a high priority on nanotechnology. While this parameter is 16 percent for Saudi Arabia, it is 5.8 percent for Singapore, the third country in this respect (Figure 1), and 3.1, 4.9, and 1.4 percent respectively for the USA, South Korea, and Japan, the top 3 countries in terms of the total number of nanotechnology patents in 2019 (Table 1).

Figure 1. The share of nanotechnology patents in the total patents published by different countries in 2019.
Source
Statnano Nanotechnology Published Patent Applications in USPTO (Patent) Indicator
Statnano Nanotechnology Published Patent Applications in EPO (Patent) Indicator
Statnano Share of Nanotechnology Patent Applications to Total Patent Applications Indicator (%)
