

Nanotechnology has many applications in various sciences as an intra-major technology, and many industries have adapted nanotechnology in the recent years. Pharmaceutics is one of the industries to invest a lot in the application of nanotechnology. Large pharmaceutical enterprises are usually very important at international level and they possess significant share among the leading enterprises all over the world. Depending on the importance of nanotechnology to the enterprises, all of them have allocated a part of their innovation and patenting to this novel technology. Patents are one of the important indicators in order to study the trend of nanotechnology penetration into pharmaceutics industry and its effects.
The list of leading enterprises presented by Forbes has been used in order to find leading enterprises in the field of pharmaceutics, and Orbit Databank to gather the number of patents have been published or granted until 30 July 2013 by those enterprises.
Table 1 lists the names of 42 pharmaceutical enterprises that have the highest number of nanotechnology-related patents (sum of granted patents and published patent applications). Three enterprises Sanofi, Novartis, and Pfizer possess the first three ranks in the number of patents in the field of nanotechnology.
Table 1: Ranking of Large Pharmaceutical Enterprises according to Published or Filed Nanotechnology-Related Patents
| No | Enterprise | Country | Nanotechnology-Related Patents | All Patents | Share of Nanotechnology Patents (%) |
|---|---|---|---|---|---|
| 1 | Sanofi |  France France | 1202 | 80933 | 1.49 |
| 2 | Novartis |  Switzerland Switzerland | 1156 | 64509 | 1.79 |
| 3 | Pfizer |  USA USA | 942 | 44335 | 2.12 |
| 4 | Merck |  Germany Germany | 910 | 52163 | 1.74 |
| 5 | AmerisourceBegen | USA | 695 | 47670 | 1.46 |
| 6 | Roche Holding | Switzerland | 693 | 34441 | 2.01 |
| 7 | Wyeth Pharmaceuticals | USA | 551 | 19003 | 2.90 |
| 8 | Abbott Laboratories | USA | 454 | 21469 | 2.11 |
| 9 | Merck & Co | USA | 325 | 3249 | 0.95 |
| 10 | AstraZeneca |  UK UK | 240 | 6876 | 3.49 |
| 11 | Bristol-Myers Squibb | USA | 236 | 13141 | 1.80 |
| 12 | GlaxoSmithKline | UK | 224 | 18740 | 1.20 |
| 13 | Cardinal Health | USA | 222 | 8839 | 2.51 |
| 14 | Eli Lilly & Co | USA | 206 | 9183 | 2.24 |
| 15 | Otsuka Holding |  Japan Japan | 113 | 5719 | 1.98 |
| 16 | Astellas Pharma | Japan | 104 | 6248 | 1.66 |
| 17 | Novo Nordisk |  Denmark Denmark | 102 | 6097 | 1.67 |
| 18 | Daiichi Sankyo | Japan | 90 | 5181 | 1.74 |
| 19 | Eisai | Japan | 86 | 3773 | 2.28 |
| 20 | AbbVie | USA | 71 | 1495 | 4.75 |
| 21 | Takeda Pharmaceutical | Japan | 64 | 5654 | 1.13 |
| 22 | Allergan | USA | 57 | 2763 | 2.06 |
| 23 | UCB |  Belgium Belgium | 57 | 3520 | 1.62 |
| 24 | Valeant Pharmaceuticals |  Canada Canada | 50 | 964 | 5.19 |
| 25 | Shionogi & Co. |  China China | 43 | 3684 | 1.17 |
| 26 | Actelion | Switzerland | 28 | 341 | 8.21 |
| 27 | SkyePharma | UK | 27 | 280 | 9.64 |
| 28 | Gilead | USA | 26 | 1740 | 1.49 |
| 29 | Shire |  Ireland Ireland | 21 | 713 | 2.95 |
| 30 | Zoetis | USA | 21 | 330 | 6.36 |
| 31 | Mylan | USA | 11 | 2300 | 0.48 |
| 32 | Enzon Pharmaceuticals | USA | 11 | 126 | 8.73 |
| 33 | McKesson | USA | 10 | 947 | 1.06 |
| 34 | Aphios | USA | 10 | 34 | 29.41 |
| 35 | Ortho Biotech | USA | 8 | 455 | 1.76 |
| 36 | Yunnan Baiyao Group | China | 7 | 123 | 5.69 |
| 37 | Sun Pharma |  India India | 5 | 90 | 5.56 |
| 38 | Forest Laboratories | USA | 5 | 298 | 1.68 |
| 39 | Sinopharm | China | 2 | 128 | 1.56 |
| 40 | Actavis | Ireland | 1 | 222 | 0.45 |
| 41 | Perrigo | Ireland | 1 | 221 | 0.45 |
| 42 | Afresa Holdings | Japan | 1 | 64 | 1.56 |
Figure 1 demonstrates the share of countries in this ranking. There are 18 enterprises from the United States among the 42 enterprises listed in Table 1. The United States possesses the first rank and Japan has the second rank by having six enterprises. Figure 2 shows the classification of the enterprises according to their continent. As is seen, continents America, Europe, and Asia rank first to third while there is no enterprise from Africa or Pacific.
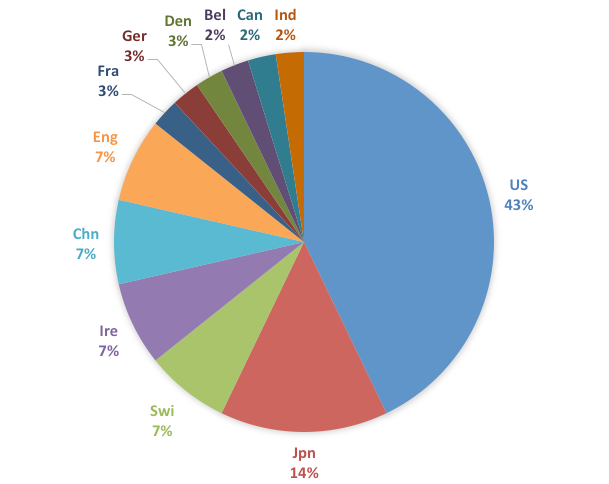
Figure 1: Share of Countries according to Number of Large Pharmaceutical Enterprises
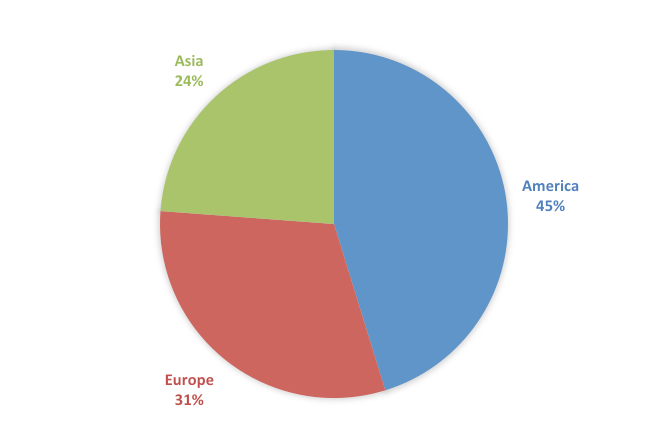
Figure 2: Share of Continents according to Number of Large Pharmaceutical Enterprises
According to information obtained from Orbit Databank, during 2001-2005, the highest number of nanotechnology-related patents has been registered by the enterprises, which is a sum total of 2387 patents.
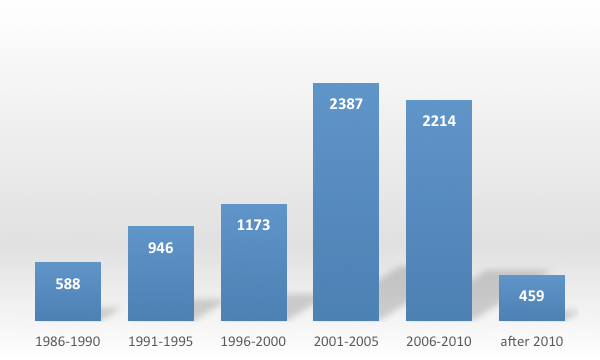
Figure 3: Timeline of Nanotechnology-Related Patent Registration by Leading Pharmaceutical Enterprises in 1986-2013
Figure 4 demonstrates the ratio of nanotechnology-related patents to all patents of different enterprises. As is observed in Figure 4, Safoni, Novartis, Merck, Pfitzer, Amersource Bergen, and Roche Holding enterprises are placed at upper right side of the chart, which is an indicator for having high number of patents and nanotechnology-related patents at the same time. It expresses that the abovementioned enterprises are among the leading enterprises in all fields of science and technology.
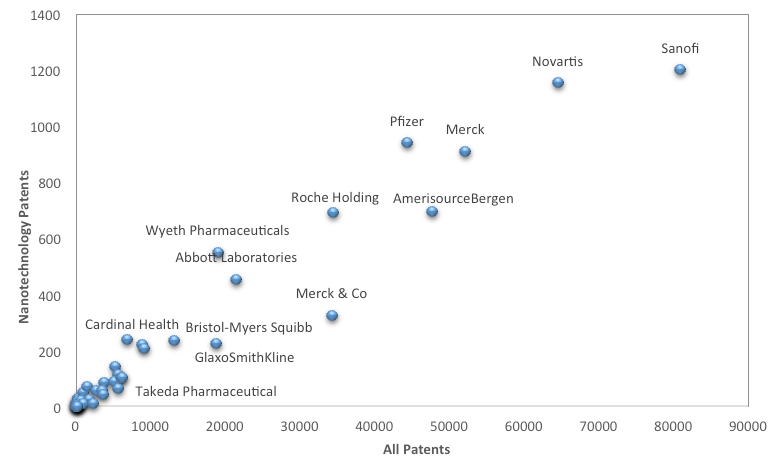
Figure 4: Distribution of Leading Pharmaceutical Enterprises according to Their Nanotechnology-Related and All Patents
Another indicator in this research is the ratio of nanotechnology-related patents to all patents (patent portfolio) of the enterprise. This indicator expresses the role of nanotechnology and its effect in the general strategy of the enterprise. As is seen in Table 1, Aphios Co. has the highest share of nanotechnology-related patents (29.41%). Although this enterprise has registered only 34 patents, almost one-third of its patents are related to nanotechnology. One of the approaches of the enterprise is the application of nanotechnology in the production protein nanoparticles, polymeric nano-spheres, and nano-phospholipids for drug delivery modification in order to increase health, to prevent diseases, and to cure some types of cancers, infectious diseases, and malfunctions in central neural systems such as Alzheimer. About 10% of patents of SkyePharma Co. are related to nanotechnology too.
Although the number of patents registered by large pharmaceutical enterprises seems to be acceptable in the field of nanotechnology, the ratio of their nanotechnology-related patents to all patents is rather low. This fact proves that the use of nanotechnology in pharmaceutical applications is a new approach. Figure 5 demonstrators top 15 pharmaceutical enterprises in the ratio of nanotechnology-related patents to all patents.
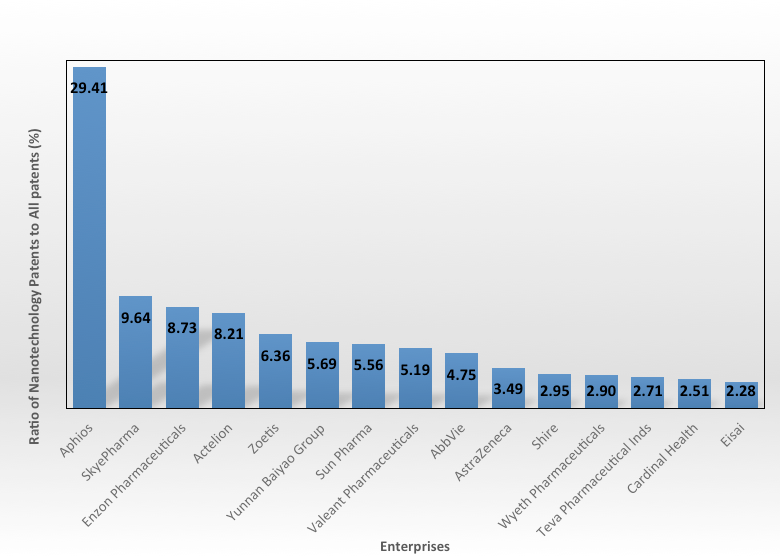
Figure 5: Top 15 Pharmaceutical Enterprises according to Ratio of Nanotechnology-Related Patents to All Patents
Figure 6 demonstrates the share of leading pharmaceutical enterprises in alive and dead nanotechnology-related patents. About 68% of nanotechnology-related patents registered by leading pharmaceutical enterprises are alive and are legally protected while 32% are dead and there is no protection for them. The figure shows that acceptable percentage (about two-third) of patents in this field is legally reliable and protected.
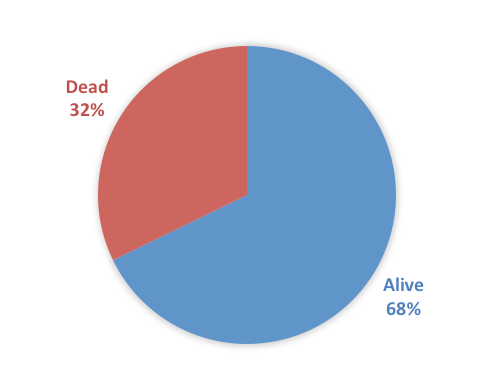
Figure 6: Legal Conditions of Nanotechnology-Related Patents of Leading Pharmaceutical Enterprises
