

According to StatNano, a sum total of 19,563 nanotechnology patents have been published in US Patent and Trademarks Office (USPTO) in 2016. About half of these patents belong to the United States while South Korea, Japan and Taiwan possess the next ranks. A sum total of 3,589 nanotechnology patents have been published in European Patent Office (EPO) in 2016.
USPTO and EPO are known as two important patent offices in the world. Statistics obtained from Orbit Database showed that 19,563 nanotechnology patents have been published in USPTO in 2016, among which 8,484 are granted patents and 11,079 are published patent applications.
According to the new definition of StatNano based on ISO/TS 18110, nanotechnology patents should either have at least one claim related to nanotechnology or have a classification code related to nanotechnology according to the International Patent Classification (IPC). Based on this definition, a number of 3,589 patents have been published in the field of nanotechnology in EPO in 2016, about 18% of the total number of nanotechnology patents published in USPTO. A number of 2,006 patents are granted while 1,583 are published patent applications.
Table 1 shows top 10 countries in nanotechnology patents in USPTO and EPO in 2016. The countries have been ranked according to the number of USPTO granted patents due to the importance of this office.
Table 1: Top 10 Countries in Nanotechnology Patents in USPTO in 2016
|
Rank* |
Country |
No. Nanotech Patents in USPTO |
No. Nanotech Patents in EPO |
Growth in USPTO Patents comparing to 2015 (%) |
Growth in EPO Patents comparing to 2015 (%) |
|---|---|---|---|---|---|
|
1 |
4316 |
577 |
-1.12 |
37.05 |
|
|
2 |
914 |
105 |
8.94 |
101.92 |
|
|
3 |
819 |
188 |
-9.20 |
43.51 |
|
|
4 |
514 |
19 |
2.80 |
58.33 |
|
|
5 |
416 |
59 |
5.85 |
110.71 |
|
|
6 |
301 |
289 |
-1.95 |
26.20 |
|
|
7 |
210 |
208 |
-13.22 |
36.84 |
|
|
8 |
136 |
71 |
-12.82 |
65.12 |
|
|
9 |
123 |
81 |
9.00 |
0 |
|
|
10 |
106 |
22 |
-3.54 |
0 |
* Ranking according to the number of published patents in USPTO.
The United States possesses the first rank by having a share of more than 50% of all nanotechnology patents in USPTO. South Korea and Japan possess the second and third ranks with a big distance from the United States. It is notable in this ranking that South Korea surpassed from Japan in this field in 2016, this matter had been predicted by StatNano in 2015 nanotechnology patents study.
Table 2 lists the number of published nanotechnology patent applications for top 10 countries. The United States, South Korea and Japan possess the three first ranks.
Table 2: Top 10 Countries in Published Nanotechnology Patent Applications in USPTO in 2016
|
Rank* |
Country |
No. Published Patents in USPTO |
No. Published Patents in EPO |
Growth in USPTO Patents comparing to 2015 (%) |
Growth in EPO Patents comparing to 2015 (%) |
|---|---|---|---|---|---|
|
1 |
5635 |
282 |
5.90 |
5.67 |
|
|
2 |
1326 |
273 |
5.83 |
26.37 |
|
|
3 |
805 |
268 |
-7.79 |
-7.46 |
|
|
4 |
591 |
97 |
-14.10 |
69.07 |
|
|
5 |
566 |
25 |
2.17 |
-280.00 |
|
|
6 |
413 |
165 |
-9.03 |
-15.15 |
|
|
7 |
284 |
92 |
-12.88 |
-35.87 |
|
|
8 |
196 |
8 |
2.62 |
-37.50 |
|
|
9 |
187 |
47 |
-11.79 |
29.79 |
|
|
10 |
132 |
47 |
11.86 |
-42.55 |
* Ranking according to the number of published patents in USPTO.
The number of nanotechnology granted patents and published patent applications in USPTO in 2016 not significantly changed and a growth of only 0.1% is observed that shows noteworthy decrease in comparison with 2015 with a growth of 8.8%. The growth of this indicator in 2016 in comparison with 2015 is 20.84% in EPO that respect to last year shows 300% growth rate. This high growth in the number of published nanotechnology patents in EPO show the special attention of countries to the Europe regional market. Figure 1 demonstrates the growth for each type of patents.
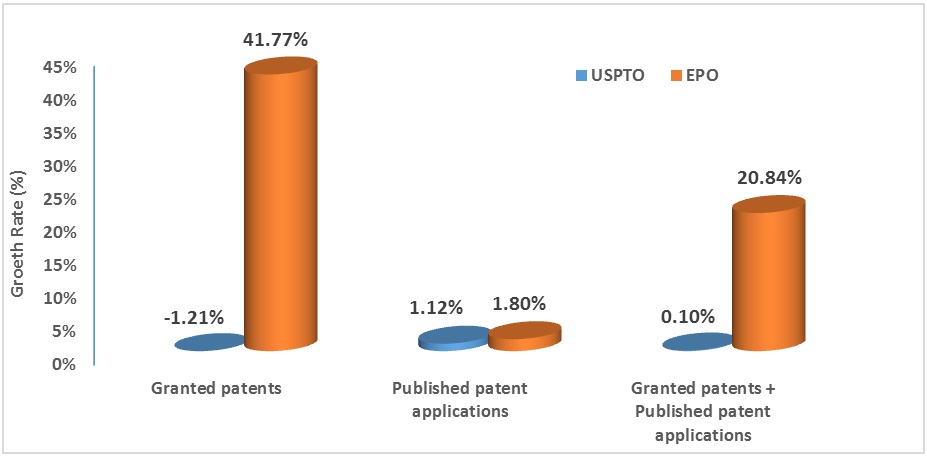
Figure 1: Growth rate of the number of nanotechnology patents in USPTO and EPO in 2016 in Comparison with 2015
