StatNano today published its annual report on the universities with the greatest number of nanotechnology patents at the USPTO, prepared by analyzing the statistical data collected by Orbit Database during 2018. Accordingly, from a total of 19,773 nanotechnology patents filed at this patent office, 3,413 were issued by universities, among which 1,432 were granted patents and 1,981 were published patent applications, altogether comprising 17% of the total nanotechnology patents of the USPTO.
The first place of the list is taken by the University of California holding the most published patent applications of 2018 in the field of nanotechnology. Founded in 1868, this university has been one of the United States’ leading public research university systems with 10 campuses all around the US, including UC Berkeley.
The list continues with Tsinghua University from Beijing, China, on the 2nd spot with 178 nanotechnology patents; followed by the King Fahd University of Petroleum and Minerals from Dhahran, Saudi Arabia, with 95 nanotechnology patents on the 3rd place. These three universities on the list rank among the top 20 nanotechnology patent assignees of 2018 at the USPTO, standing above even many industrial nanotechnology patent holders.
The table below lists the names of the top 30 universities owning the largest number of the nanotechnology patents of 2018 at the USPTO, in descending order; along with their respective shares of nanotechnology patents in their total patents issued in all fields of science and technology, revealing that all these 30 universities have nanotechnology patent shares below 50%, with Tsinghua University at the forefront holding a share around 44%; nanotechnology can thus be considered as one of the strongest research areas of this university.
Table 1. The top 30 academic nanotechnology patent assignees of 2018 at the USPTO
|
Rank |
Assignee |
No. of Nanotechnology Patents |
No. of Patents in All Fields of Science and Technology |
Share of Nanotechnology Patents in Total Patents |
|
1 |
UNIVERSITY OF CALIFORNIA |
262 |
1467 |
17.86% |
|
2 |
TSINGHUA UNIVERSITY |
178 |
407 |
43.73% |
|
3 |
KING FAHD UNIVERSITY OF PETROLEUM AND MINERALS |
95 |
392 |
24.23% |
|
4 |
UNIVERSITY OF TEXAS SYSTEM |
83 |
565 |
14.69% |
|
5 |
NORTHWESTERN UNIVERSITY |
62 |
264 |
23.48% |
|
6 |
LELAND STANFORD JUNIOR UNIVERSITY |
57 |
508 |
11.22% |
|
7 |
CORNELL UNIVERSITY |
55 |
210 |
26.19% |
|
8 |
UNIVERSITY OF FLORIDA |
53 |
271 |
19.56% |
|
9 |
JOHNS HOPKINS UNIVERSITY |
44 |
398 |
11.06% |
|
10 |
UNIVERSITY OF MICHIGAN |
43 |
336 |
12.80% |
|
11 |
UNIVERSITY OF ILLINOIS |
42 |
224 |
18.75% |
|
12 |
UNIVERSITY OF MASSACHUSETTS |
40 |
175 |
22.86% |
|
13 |
WASHINGTON UNIVERSITY |
39 |
168 |
23.21% |
|
14 |
KING ABDULLAH UNIVERSITY OF SCIENCE AND TECHNOLOGY |
38 |
138 |
27.54% |
|
15 |
SUNGKYUNKWAN UNIVERSITY |
38 |
179 |
21.23% |
|
16 |
KING SAUD UNIVERSITY |
37 |
101 |
36.63% |
|
17 |
KOREA UNIVERSITY RESEARCH AND BUSINESS FOUNDATION |
35 |
205 |
17.07% |
|
18 |
CASE WESTERN RESERVE UNIVERSITY |
35 |
224 |
15.63% |
|
19 |
NANYANG TECHNOLOGICAL UNIVERSITY |
34 |
116 |
29.31% |
|
20 |
UNIVERSITY OF PENNSYLVANIA |
34 |
297 |
11.45% |
|
21 |
UNIVERSITY OF MINNESOTA |
33 |
283 |
11.66% |
|
22 |
CITY UNIVERSITY OF HONG KONG |
32 |
101 |
31.68% |
|
23 |
UNIVERSITY OF NORTH CAROLINA |
31 |
183 |
16.94% |
|
24 |
COLUMBIA UNIVERSITY IN THE CITY OF NEW YORK |
31 |
243 |
12.76% |
|
25 |
PRINCETON UNIVERSITY |
31 |
107 |
28.97% |
|
26 |
UNIVERSITY OF CENTRAL FLORIDA |
30 |
89 |
33.71% |
|
27 |
YALE UNIVERSITY |
30 |
162 |
18.52% |
|
28 |
UNIVERSITY OF HOUSTON SYSTEM |
27 |
89 |
30.34% |
|
29 |
ARIZONA STATE UNIVERSITY |
26 |
235 |
11.06% |
|
30 |
UNIVERSITY OF MISSOURI |
26 |
91 |
28.57% |
Most patent holders file their patents in collaboration with other universities or industrial research centers; among the top 3 universities of the list, the University of California has had the greatest number of collaborators in publishing its nanotechnology patents. Tsinghua University, for instance, has jointly worked with the world's largest contract electronics manufacturer, Hon Hai Precision Industry Co., Ltd., trading as Foxconn Technology Group, in so far as 90% of the nanotechnology patents of this university have been jointly issued with this company.
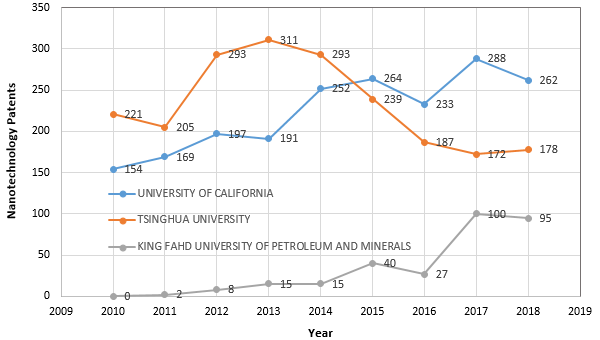
The following graph indicates the number of the nanotechnology patents annually filed by the first 3 universities of the list between 2011 and 2018. The universities of California and Tsinghua have clearly had significant activities in publishing nanotechnology patents during this period; King Fahd University, however, is somewhat a newcomer to this field. Unlike the universities of California and King Fahd whose nanotechnology patents show growing trends throughout these years, Tsinghua University’s patents have so far been on the decline since their peak in 2013 with 311 patents.

Figure 1. The number of nanotechnology patents issued annually by the top 3 universities at the USPTO 2011-2018.


