As a determining indicator for evaluating the quality of articles, the 5-year average citation per article generally shows the share of highly-cited and lowly-cited articles by a researcher, institution, or country. For example, a high value of this indicator means that the proportion of lowly-cited articles is smaller in the distribution of the articles of a given country; in other words, most of the articles are highly-cited or medium-cited articles.
Looking back, Western European countries in general, and Denmark, the Netherlands, Switzerland, and Sweden in particular, have had high average citation per article, despite their relatively low publication rate. In the past decade, however, Asian and Pacific countries have reached the top in terms of this indicator, especially in the field of nanotechnology.
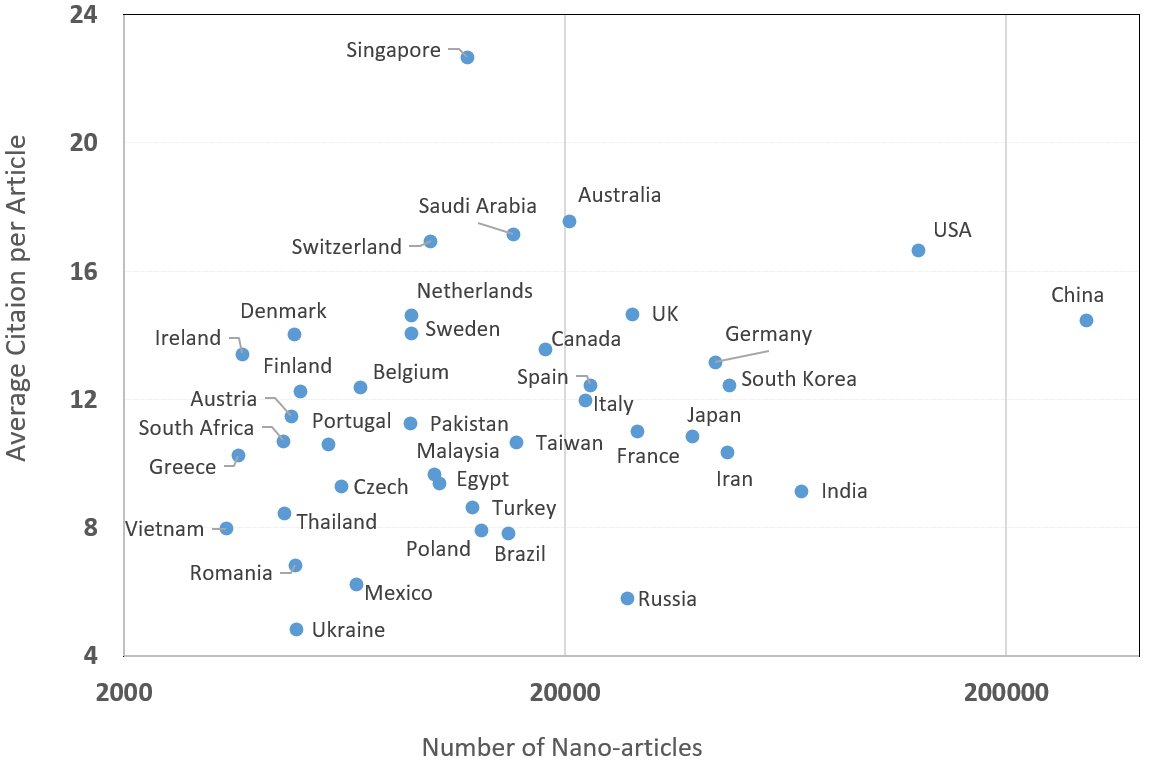
According to StatNano’s statistics collected from the WoS Database, Singapore published nearly 12,000 nano-articles between 2015 and 2019, with an average of 22.6 citations per article during this period. The indicator is 16.6 for the United States and 14.5 for China, the world’s leaders in nanoscience publications. Australia has taken the second place in average citation per nano-article, followed by Saudi Arabia, Switzerland, and the Netherlands holding the third to fifth spots.

The figure above shows the distribution of 40 leading countries considering their number of nano-articles and 5-year average citation per article. Accordingly, apart from China, the UK, Germany, and South Korea are also in the average range; while India's position as the world's third-largest publisher of nano-articles in this chart points out that the share of lowly-cited nano-articles in this country has been relatively high.
It should be noted that the indicator alone does not directly indicate the quality of a country's articles, but since it has been normalized in terms of the number of articles, it can be employed to compare the quality of scientific publications of different countries.


