
Called Alvis, the new visualisation tool examines mappings between DNA sequence data and reference genome databases. This allows bioinformaticians to more easily analyse their data generated from common genomics tasks and formats by producing efficient, ready-made vector images.
First author and post-doctoral scientist at the Earlham Institute Dr Samuel Martin in the Leggett Group, said: “Typically, alignment tools output plain text files containing lists of alignment data. This is great for computer parsing and for being incorporated into a pipeline, but it can be difficult to interpret by humans.
“Visualisation of alignment data can help us to understand the problem at hand. As a new technology, several new alignment formats have been implemented by new tools that are specific to nanopore sequencing technology.
“We found that existing visualisation tools were not able to interpret these formats; Alvis can be used with all common alignment formats, and is easily extensible for future ones.”
A key feature of the new command line tool is its unique ability to automatically highlight chimeric sequences - weak links in the DNA chain. This is where two sequences - from different parts of a genome or different species - are linked together by mistake to make one, affecting the data’s accuracy.
Chimera sequences can be problematic for bioinformaticians when identifying specific DNA. The chimera formation can physically happen to the DNA molecules during either sequencing library preparation, during the sequencing process on some platforms, and by assembly tools when trying to piece together a genome.
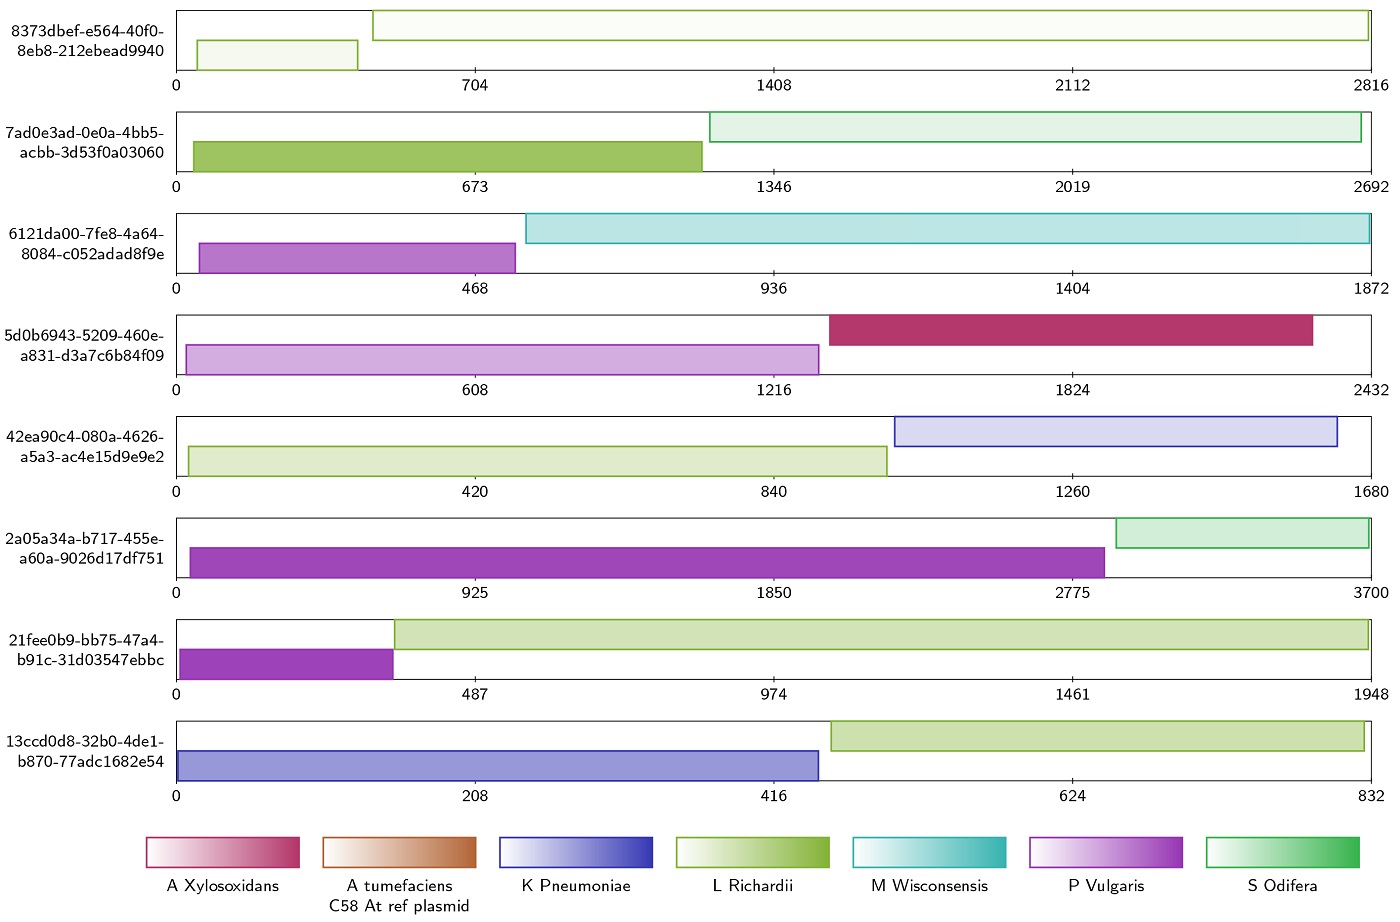
During the development of the tool, the team compared genome assemblies with and without using Alvis chimera detection. The vector image produced (above) shows an example output, where the intuitive tool tracks all reads it recognises as chimeras.
“Although chimeric sequences don’t make up a large proportion of samples, they can have a significant effect, so we have to be careful that we have identified them during analysis,” said Dr Martin.
“In the Alvis diagram example of chimera data, each rectangle across the page represents a read, and the coloured blocks inside them represent alignments. Most chimeras are easy to see because their alignments are different colours, meaning they map to different genomes. Others are more subtle because both alignments are to the same genome, but different regions.”
The Alvis tool can pinpoint visualisation of only chimeric sequences for further inspection, and output numerical data describing the chimeras. This demonstrates that by applying the tool and then bioinformatically splitting the chimeras, the quality of the assemblies is significantly improved.
Accessed nearly 600 times since being made available at the beginning of March this year, Dr Martin, adds: “We hope that Alvis continues to be useful to other researchers working with, for example, nanopore sequencing; improving their understanding of their data by visualising alignments,''.
“Alignments are so fundamental to bioinformatics that it could be of use to anyone working with long read sequencing data, as well as alignments generated by sequencing data from short-read platforms. The diagrams that Alvis generates can be easily exported to directly use in publications, demonstrated in our study already.”
Read the original article on Earlham Institute.