

According to a statistical analysis conducted by StatNano using data from the Orbit database, the USPTO published 84% of the 18,526 nanotechnology patent applications in 2023, which is more than five times the number published by the EPO. However, the EPO saw a nearly 17% increase in nanotechnology patent publications compared to the previous year, while the USPTO's growth was around 4%.
Nanotechnology patents are defined based on the ISO/TS 18110 standard as those having at least one claim related to nanotechnology orpatents classified with an IPC classification code related to nanotechnology such as B82.
The following table presents the statistics of nanotechnology published patent applications for the top 10 countries in 2023.
Top 10 Countries Based on Published Patent Applications in the Field of Nanotechnology in USPTO in 2023
|
Rank1 |
Country |
Number of nanotechnology published patent applications in USPTO |
Number of nanotechnology published patent applications in EPO |
Growth rate in USPTO |
Growth rate in EPO |
|
1 |
6,926 |
492 |
3.20% |
17.40% |
|
|
2 |
1,715 |
476 |
13.40% |
8.40% |
|
|
3 |
1,627 |
569 |
4.20% |
47.40% |
|
|
4 |
1,118 |
61 |
5.00% |
-12.90% |
|
|
5 |
1,113 |
445 |
-1.20% |
9.30% |
|
|
6 |
484 |
229 |
-10.20% |
15.70% |
|
|
7 |
331 |
50 |
5.10% |
16.30% |
|
|
8 |
323 |
145 |
-8.00% |
17.90% |
|
|
9 |
290 |
12 |
5.10% |
-14.30% |
|
|
10 |
268 |
3 |
22.40% |
0.00% |
1- Ranking based on the number of nanotechnology patent applications at the USPTO
Consistent with previous years, after the United States, the next four positions were occupied by East Asian countries, reflecting their focus on the US technology market and securing patent protection for their inventions in the country. The three European countries of Germany, the United Kingdom, and France followed in the subsequent ranks.
Among the top 10 countries, Saudi Arabia witnessed a remarkable 22.4% growth in nanotechnology patent applications filed with the USPTO in 2023, while South Korea experienced a 13.4% increase. This substantial growth enabled South Korea to surpass China and secure the second position, while Saudi Arabia emerged as a new entrant among the top 10 countries for nanotechnology patent publications at the USPTO.
With the exception of Taiwan, Canada, and Saudi Arabia, the remaining seven countries among the top ten witnessed an increase in the number of nanotechnology patent applications filed with the European Patent Office (EPO) in 2023. China experienced the highest growth rate of 47%, highlighting the strong emphasis from Chinese technologists on securing patent protection for their nanotechnology inventions in the European market.
In 2023, nanotechnology patent publications accounted for approximately 3% of all patent applications filed with the United States Patent and Trademark Office (USPTO), while this figure stood at 7.5% for the European Patent Office (EPO). The following figure shows the trend of this share for both US and European patent offices in recent years. According to this diagram, the share of nanotechnology patents in total patents has been growing steadily.
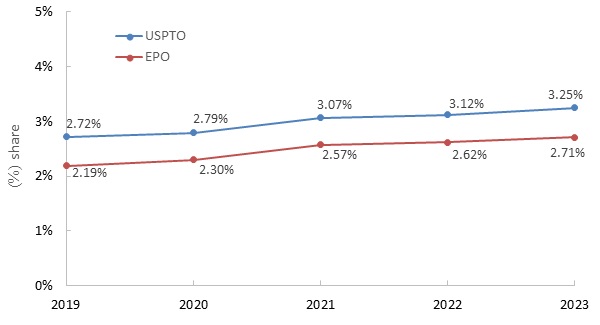
Share of Nanotechnology patent to total patent at the USPTO and EPO in different years.
