USTPO and EPO are known as two important patent offices in the world. According to statistical analysis on Orbit Databank, a number of 20187 nanotechnology patents have been published in USPTO in 2017, among which 9145 are granted patents and 11042 are published patent applications. According to the new definition of International Standard Organization (ISO/TS 18110), a patent is related to nanotechnology when it has at least one claim about nanotechnology or it has a code related to nanotechnology according to IPC. By using this definition, a number of 4019 nanotechnology patents have been published in EPO in 2017, which is about one-fifth of the number of nanotechnology patents in USPTO. There are 2386 granted patents and 1633 published patent applications in EPO in the field of nanotechnology.
Table 1 shows top ten countries in the world in number of nanotechnology granted patents published in USPTO and EPO in 2017. The countries have been ranked according to the number of USPTO patents due to the importance and the higher number of patents in this office.
Table 1: Top ten countries in the number of nanotechnology granted patents published in USPTO in 2017
|
Rank |
Country |
Granted patents in USPTO |
Granted patents in EPO |
Growth of USPTO patents compared to 2016 (%) |
Growth of EPO patents compared to 2016 (%) |
|
1 |
4725 |
669 |
9.48 |
15.94 |
|
|
2 |
1044 |
166 |
14.22 |
58.10 |
|
|
3 |
733 |
265 |
-10.50 |
40.96 |
|
|
4 |
524 |
64 |
25.96 |
8.47 |
|
|
5 |
490 |
15 |
-4.67 |
-21.05 |
|
|
6 |
378 |
354 |
25.58 |
22.49 |
|
|
7 |
235 |
236 |
11.90 |
13.46 |
|
|
8 |
144 |
89 |
17.07 |
9.88 |
|
|
9 |
122 |
69 |
-10.29 |
-2.82 |
|
|
10 |
119 |
29 |
12.26 |
31.82 |
The United States possesses the first rank by having a share of about 51.7% of all nanotechnology patents in USPTO. South Korea and Japan rank second and third, respectively with a great difference with the United States. South Korea took the second place of Japan in 2016 with a significant growth in the number of nanotechnology patents. The growth in the number of nanotechnology patents in South Korea continued in 2017, and due to the negative growth of Japan’s nanotechnology patents, the difference between the two countries increased. Table 2 lists the number of nanotechnology published patent applications for the top 10 countries. The countries the United States, South Korea, and Japan rank first to third in this ranking, too.
Table 2: Top ten countries in the number of nanotechnology published patent applications in USPTO in 2017
|
Rank |
Country |
Published patent applications in USPTO |
Published patent applications in EPO |
Growth of USPTO patents compared to 2016 (%) |
Growth of EPO patents compared to 2016 (%) |
|
1 |
5559 |
310 |
-1.35 |
9.93 |
|
|
2 |
1254 |
246 |
-5.43 |
-9.89 |
|
|
3 |
766 |
235 |
-4.84 |
-12.31 |
|
|
4 |
694 |
159 |
17.43 |
63.92 |
|
|
5 |
516 |
23 |
-8.83 |
-8.00 |
|
|
6 |
433 |
159 |
4.84 |
-3.64 |
|
|
7 |
280 |
102 |
-1.41 |
10.87 |
|
|
8 |
226 |
36 |
20.86 |
-23.40 |
|
|
9 |
171 |
15 |
-12.76 |
87.50 |
|
|
10 |
153 |
6 |
128.36 |
-25.00 |
The interesting point is the 10th position of Saudi Arabia in this ranking, which occurs for the first time. The reason is the growth of 128% in the number of nanotechnology published patent applications of this country in 2017.
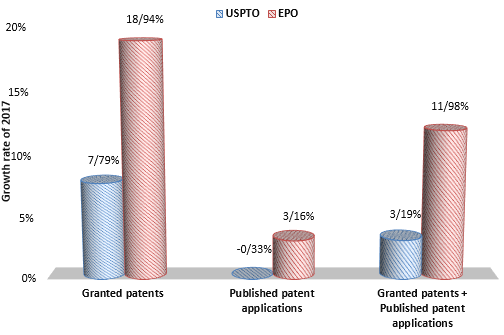
The number of nanotechnology published patent applications in USPTO in 2017 shows a growth of 3.2% in comparison with 2016. This growth is about 12% for the number of nanotechnology published patent applications in EPO in 2017 in comparison with 2016. Figure 1 demonstrates the growth in the number of patents according to the type of patents.

Fig 1: Growth in the number of nanotechnology patents in USPTO and EPO in 2017 compared to 2016.
Click here to see full statistics on nanotechnology patents of various countries.


