

According to StatNano, the United States Patent and Trademark Office (USPTO) granted over 392,000 patents in 2019, 9515 of which (around 2.5 percent) were related to nanotechnology. This meager share – compared to the share of nanotechnology publications in the total scientific publications of the world – reveals that a significant percentage of scientific advances relating to nanotechnology still have a long way to go before they can be transferred from academia to industry. Along with the USA and Europe, China and South Korea’s patent offices are also among nanotechnology innovators’ first choices, but considering the limitation of their offices’ search engines, it is not possible to search and collect information about different countries’ patents in these offices.
Reportedly, only 30 countries could annually file more than 10 nanotechnology patents at the USPTO so far, not including Russia, Poland, Portugal, and Czech Republic. The table below lists the numbers and shares of different countries’ nanotechnology patents in their total patents granted by the USPTO in the past year; following the USA at the first rank with 4,837 nanotechnology patents, South Korea, China, Japan, and Taiwan, respectively, took the next places of the list with 931, 746, 707, and 505 patents relating to nanotechnology, suggesting that Asian countries, especially East Asians, were as successful in nanotechnology patents as they were in nanotechnology publications in 2019, due mainly to their special focus on this area.
Accordingly, the numbers of nanotechnology patents of some scientifically developed countries such as Germany, France, Switzerland, and Japan were below the global average last year. Figure 1 draws a clear comparison between different countries’ shares of nanotechnology patents in their total patents published at the USPTO in 2019.
Table 1. The numbers and shares of different countries’ nanotechnology patents in their total patents filed at the USPTO in 2019
|
Rank |
Country |
Nanotechnology Patents |
Share of nano-patents in the total (%) |
|
1 |
4837 |
2.4 |
|
|
2 |
931 |
3.8 |
|
|
3 |
746 |
3.3 |
|
|
4 |
707 |
1.2 |
|
|
5 |
505 |
4.1 |
|
|
6 |
348 |
1.9 |
|
|
7 |
233 |
3.3 |
|
|
8 |
176 |
16.8 |
|
|
9 |
149 |
2.3 |
|
|
10 |
145 |
2.4 |
|
|
11 |
87 |
1.7 |
|
|
12 |
86 |
1.7 |
|
|
13 |
78 |
3.8 |
|
|
14 |
65 |
3.9 |
|
|
15 |
60 |
4.9 |
|
|
16 |
56 |
2.0 |
|
|
17 |
43 |
1.1 |
|
|
18 |
42 |
3.2 |
|
|
19 |
37 |
2.1 |
|
|
20 |
33 |
4.5 |
|
|
21 |
25 |
1.9 |
|
|
22 |
21 |
1.5 |
|
|
23 |
21 |
1.3 |
|
|
24 |
16 |
3.0 |
|
|
25 |
16 |
18.4 |
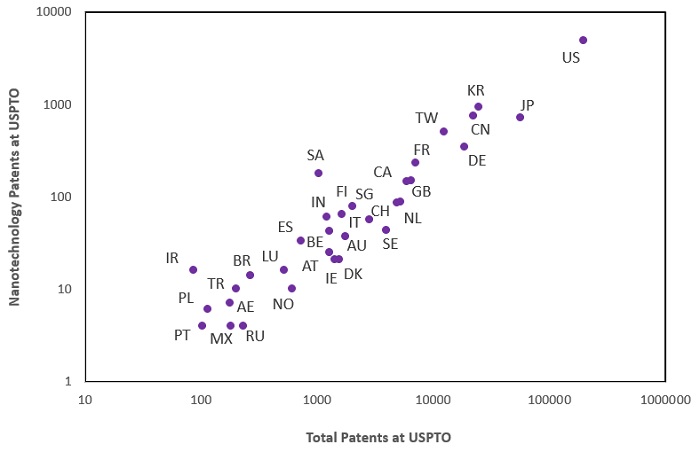
Figure 1. Different countries’ shares of nanotechnology patents in their total patents published at the USPTO in 2019.
Source
Nanotechnology patents in USPTO (Patent)
