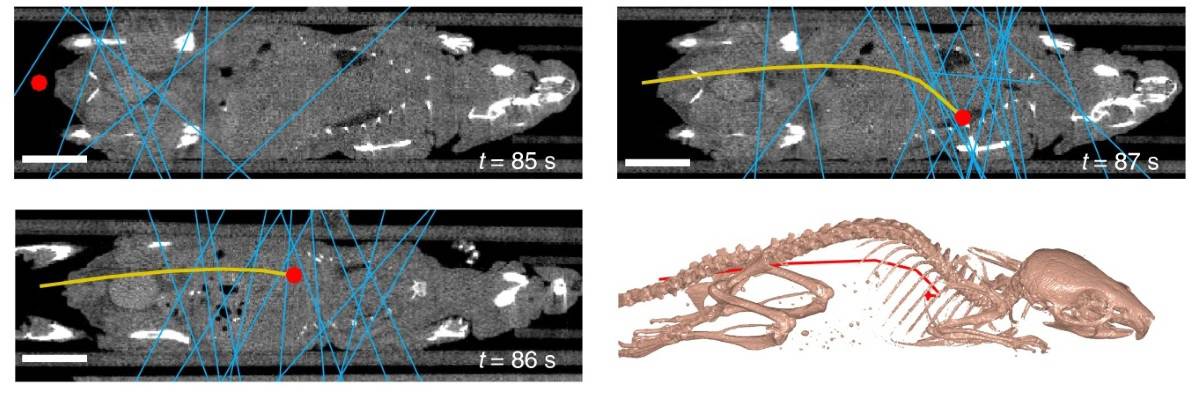
 Dynamic tracking of a single cell in vivo at three time points. The blue lines represent detected coincidence events, the red dot is the estimated cell location, the yellow line is the reconstructed trajectory. Bottom-right: reconstructed trajectory with respect to the bony anatomy. (Courtesy: Nat. Biomed. Eng. 10.1038/s41551-020-0570-5)
To demonstrate that single cells can be imaged beyond the 67 min half-life of 68Ga, the researchers also tested the CellGPS workflow using zirconium-89 (89Zr, a positron-emitting radionuclide with a half-life of 78 hr). They intravenously injected single cells labelled with 89Zr-MSNs into two mice and imaged them over multiple days using PET. A single focus of uptake could be detected in the lungs for up to 48 hr and remained stable.
