StatNano, a comprehensive statistical database portal, which has been compiling and releasing the data and statistics related to nanotechnology using scientific methodologies since 2010, is today one of the most reliable references of researchers and policymakers around the world. The statistics of the nano-articles published by each country are reported by StatNano on a monthly basis, which collects them by searching the appropriate terms in the search engine of the WoS.
Accordingly, in 2018, more than 166,000 articles related to nanotechnology were published, indicating an increase of more than 7% compared to the corresponding period last year. In addition to research articles, over 9,000 review articles were also published in the past year, which comprise nearly 5% of all nanotechnology publications.
In 2018 compared with 2017, the top 5 countries of the world in nanoscience generation remained on their previous spots; among the rest of the countries on the list, however, England moving up one place surpassed France, Saudi Arabia and Taiwan switched spots, and Egypt with a three-step climb could rank among the top 20 countries in this area.
The top 20 countries based on their number and share of nano-articles carried in 2018
|
Rank |
Country |
Nano-articles |
Share (%) |
|
1 |
65,594 |
39.47 |
|
|
2 |
24,514 |
14.75 |
|
|
3 |
14,036 |
8.45 |
|
|
4 |
9,662 |
5.81 |
|
|
5 |
9,372 |
5.64 |
|
|
6 |
8,448 |
5.08 |
|
|
7 |
7,381 |
4.44 |
|
|
8 |
5,667 |
3.41 |
|
|
9 |
5,412 |
3.26 |
|
|
10 |
5,309 |
3.19 |
|
|
11 |
4,518 |
2.72 |
|
|
12 |
4,227 |
2.54 |
|
|
13 |
4,122 |
2.48 |
|
|
14 |
3,603 |
2.17 |
|
|
15 |
3,109 |
1.87 |
|
|
16 |
3,075 |
1.85 |
|
|
17 |
2,885 |
1.74 |
|
|
18 |
2,491 |
1.50 |
|
|
19 |
2,438 |
1.47 |
|
|
20 |
2,235 |
1.34 |
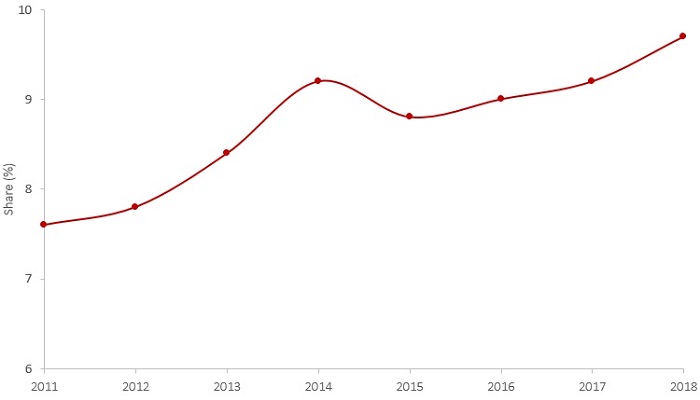
As in the past years, the share of nano-articles in the total scientific publications has still been growing. In 2018, around 9.7% of the total scientific publications were related to nanotechnology, which has been the highest since 2014.

The share of nano-articles in the total articles published worldwide in each year from 2011 to 2018.
In terms of local share, which is the ratio of the nano-articles carried in a country to the total articles of that country, Iran, Saudi Arabia, China, and India, took the top 4 places on the list compiled using this indicator, respectively. Iraq having only 463 nano-articles in 2018, which interestingly comprises nearly 17% of its total scientific publications in this year, could surprisingly reach the 5th spot on this list.
The top 15 countries ranked in order of their local share of nano-articles in 2018
|
Rank |
Country |
Local Share (%) |
|
1 |
22.03 |
|
|
2 |
18.82 |
|
|
3 |
17.33 |
|
|
4 |
17.24 |
|
|
5 |
16.90 |
|
|
6 |
16.02 |
|
|
7 |
15.43 |
|
|
8 |
14.80 |
|
|
9 |
14.77 |
|
|
10 |
13.62 |
|
|
11 |
13.29 |
|
|
12 |
12.31 |
|
|
13 |
12.01 |
|
|
14 |
11.84 |
|
|
15 |
11.38 |
Given the subject matter of the nano-articles published in 2018, the greatest number of the articles were run in the fields of chemistry, materials science, physics, and engineering science, respectively. The four journals of ACS Applied Materials & Interfaces, Applied Surface Science, RCS Advances, and Nanoscale had the largest shares in the publication of nano-articles in this year. The Chinese Academy of Sciences, Islamic Azad University from Iran, the Russian Academy of Sciences, and Tsinghua University from China carried the largest number of nano-articles last year.


